.svg)
The Only 7 Email Marketing KPIs That Matter (2026)
.avif)
Email marketing delivers between $36 and $42 in return for every $1 spent, according to Litmus's ROI analysis. But that number is meaningless if you're watching the wrong metrics. Most marketers track everything their ESP dashboard shows them. That's the problem. More data isn't better data. The seven email marketing KPIs covered here are the ones that actually tell you whether your programme is working, where revenue is leaking, and what to fix first.

Most email marketing metrics guides list 15 or 20 KPIs. Some go further. And yet the marketers we work with at Enchant, across brands like Self Portrait, Bohomoon, and Timex, consistently move the needle by obsessing over a much shorter list. Not because the other numbers don't exist. Because clarity beats volume when you're trying to make decisions fast.
What Are Email Marketing KPIs (and Why Do They Matter)?
Email marketing KPIs are the specific, measurable key performance indicators that show whether your campaigns and automations are producing real commercial outcomes, not just activity.
The distinction matters. Open rate is a metric. Revenue per recipient is a KPI. One tells you something happened. The other tells you something was earned. Plenty of email marketing metrics dashboards are full of the former and short on the latter.
Tracking the right key performance indicators lets you diagnose problems at the right level. A falling conversion rate with a stable click-through rate points to a landing page problem, not an email problem. A low inbox placement rate with a healthy open rate suggests your data is skewed, possibly by Apple Mail Privacy Protection. You can only make those calls if you're watching the right things.
The seven email marketing KPIs below cover the full funnel: deliverability, engagement, and revenue. Each one includes its formula, a current industry benchmark, and specific actions to improve it.
KPI 1: Email Delivery Rate
Email delivery rate measures the percentage of sent emails that were accepted by the receiving mail server, calculated as (emails delivered / emails sent) x 100.
Your delivery rate is the floor everything else sits on. If emails aren't reaching servers at all, open rate, CTR, and conversion rate become irrelevant. An email that bounces never had a chance.
Formula and Benchmark
Formula: (Emails Delivered / Emails Sent) x 100
A healthy delivery rate sits above 98%. Anything below 95% warrants immediate investigation. Bear in mind that delivery rate and deliverability rate are different things. Delivery rate confirms server acceptance. It doesn't confirm inbox placement.
How to Improve Email Delivery Rate
- Authenticate your sending domain. SPF, DKIM, and DMARC records tell receiving servers that your emails are legitimate. Without them, you're asking mail servers to trust a stranger. Most ESPs including Klaviyo and HubSpot walk you through setup in their documentation.
- Suppress hard bounces immediately. Sending to invalid addresses signals to ISPs that you don't maintain your list. One hard bounce should trigger immediate suppression.
- Warm up new sending domains gradually. Starting at full send volume on a new IP or domain is one of the fastest ways to destroy your sender reputation before your programme gets going.
- Remove unengaged subscribers before major sends. Segmenting out contacts who haven't opened or clicked in 90 to 180 days protects your reputation and keeps delivery rate high.
Delivery rate is table stakes. Once it's solid, the real work begins with inbox placement.
KPI 2: Email Deliverability Rate (Inbox Placement Rate)
Email deliverability rate, also called inbox placement rate, measures the percentage of delivered emails that land in the inbox rather than the spam or junk folder, and Validity's 2026 deliverability benchmark report puts the global average inbox placement rate at 87.2%.
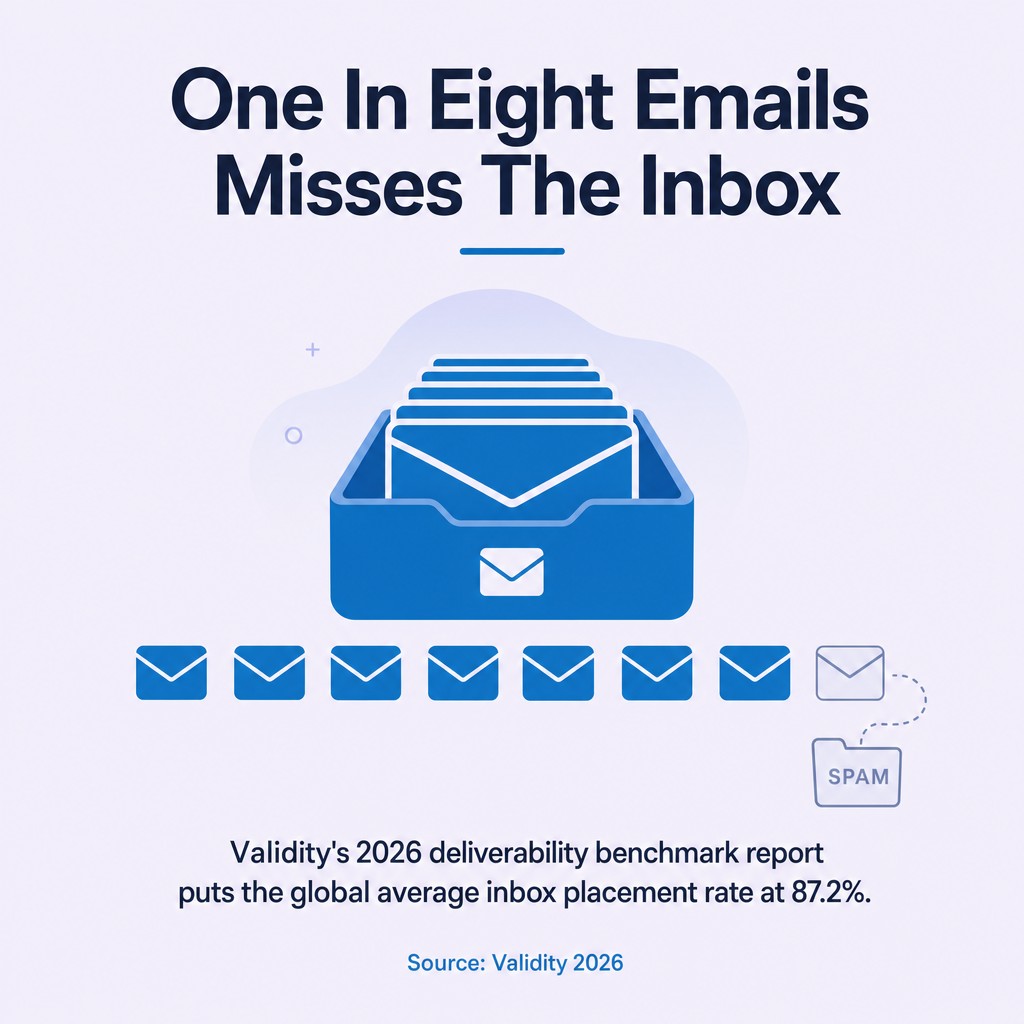
That number is lower than most marketers assume. Roughly one in eight emails that "delivered" never reached the inbox. They're sitting in spam folders. Nobody's opening them. And your delivery rate looks fine.
Delivery vs. Deliverability: The Difference That Costs Revenue
Delivery rate tells you the email reached the server. Deliverability rate (inbox placement) tells you the email reached the person. These two email marketing KPIs measure completely different things and you need both.
Poor inbox placement is almost always a sender reputation problem. ISPs score your sending behaviour based on engagement signals, complaint rates, authentication, and list hygiene. Low scores push you to spam, even if every technical authentication check passes.
How to Improve Inbox Placement Rate
- Monitor your sender reputation. Tools like Google Postmaster Tools give you domain reputation data directly from Google. Check it regularly, not just when you suspect a problem.
- Cut your spam complaint rate. Google requires senders to stay below a 0.10% spam complaint rate, according to Martech's reporting on Google's bulk sender rules. Breaching that threshold affects inbox placement across your entire programme.
- Segment by engagement. Sending to your most engaged subscribers more often, and your less engaged ones less often, signals to ISPs that your list wants your mail.
- Use seed testing before major campaigns. Tools like Email on Acid let you test inbox placement across mail clients before you send.
Our email marketing deliverability service covers this in full, including authentication audits, reputation monitoring, and list hygiene frameworks. It's one of the areas where most brands are losing revenue quietly.
KPI 3: Open Rate
Open rate measures the percentage of delivered emails that were opened, calculated as (unique opens / emails delivered) x 100, but Apple Mail Privacy Protection now makes this one of the most contested email marketing KPIs on any dashboard.
Apple MPP pre-fetches email content to protect user privacy, which registers an open regardless of whether the recipient actually read the email. Research cited by Hooked Marketing's 2026 benchmark compilation estimates that Apple MPP affects approximately 49% of all tracked email opens, inflating reported rates by an estimated 15 to 20 percentage points.
The Benchmark Problem
Published benchmarks now vary dramatically because of MPP. WebFX reports a cross-industry average open rate of 19.21%. MailerLite reports a median of 43.46% for 2025. That gap isn't explained by industry differences. It's explained by how each platform handles Apple MPP data.
Only 15% of email marketers now use open rate as a primary success metric, according to Angaru Media's 2026 benchmark report. That's the right direction. Open rate still has value as a directional signal, particularly for subject line testing. But it should not anchor your performance reporting.

How to Use Open Rate Correctly
- Use it for relative comparison, not absolute benchmarking. Track open rate trends within your own programme. A 10% drop in your own open rate is meaningful. Comparing your rate to an industry average that may include Apple MPP inflation is not.
- Segment Apple MPP openers. Most major ESPs can flag Apple MPP opens separately. Remove them from your primary open rate calculation for cleaner data.
- Test subject lines using click-through rate as the success metric. Subject lines drive opens, but CTR confirms the email itself performed. Use both together.
- Focus on send time and preheader text. These directly influence genuine open behaviour and are still worth optimising even when the metric itself is noisy.
For a full playbook on improving this metric, our guide to improving your email marketing open rate covers subject line testing, segmentation, and send time in detail.
KPI 4: Click-Through Rate (CTR)
Click-through rate measures the percentage of delivered emails where at least one link was clicked, calculated as (unique clicks / emails delivered) x 100, and Brevo's 2026 email marketing benchmark puts the average CTR for marketing campaigns at 2.27%.
CTR is the most reliable engagement signal in email marketing right now. Unlike open rate, it doesn't get inflated by privacy proxies. A click requires a real person to make a deliberate decision. That makes CTR one of the email marketing KPIs most worth protecting.
CTR vs. Click-to-Open Rate (CTOR)
CTR and CTOR measure different things. CTR measures clicks against all delivered emails. CTOR measures clicks against only those who opened. CTOR tells you how persuasive your email content is. CTR tells you how the whole campaign performed. Both matter. Use CTOR to evaluate email design and CTA copy. Use CTR for overall campaign benchmarking.
CTOR Formula: (Unique Clicks / Unique Opens) x 100
How to Improve Click-Through Rate
- Use one primary CTA per email. Multiple competing calls to action reduce the likelihood of any single one being clicked. Pick the most important action and build the email around it.
- Make your CTA mobile-first. Most opens happen on mobile. A CTA button needs to be large enough to tap with a thumb, with enough padding around it. Our ecommerce email marketing best practices guide covers mobile CTA sizing in detail.
- Personalise the link destination, not just the email content. Sending someone to a generic homepage after a personalised email is a lost conversion. Match the landing page to the email's specific offer.
- Segment before you send. Sending the same email to your entire list is one of the most reliable ways to keep CTR low. Segmented campaigns consistently outperform broadcast sends on click-through rate.
CTR is where email design decisions show up in the data. If you want to understand exactly where subscribers are clicking and why, our eye tracking research service gives you that visibility at a level most agencies simply can't offer.
KPI 5: Conversion Rate
Email conversion rate measures the percentage of delivered emails that resulted in the desired action (purchase, sign-up, download, or similar), calculated as (conversions / emails delivered) x 100, with Omnisend's email marketing benchmark data putting the average automated email conversion rate at 1.49%.
Conversion rate is the KPI that converts email performance into a business outcome. Everything upstream, delivery rate, open rate, CTR, is in service of this number. If your conversion rate is low but CTR is healthy, the problem isn't your email. It's what happens after the click.
Attribution Matters Here
Conversion rate is only as accurate as your attribution setup. Without UTM parameters on your email links and proper goal tracking in your analytics platform, you're guessing. Set up UTM tracking on every link in every email before you start benchmarking conversion rate. Klaviyo's attribution window settings also directly affect how conversions are counted. Our guide to Klaviyo's attribution window tool walks through exactly how to configure this for accurate reporting.
How to Improve Email Conversion Rate
- Fix the landing page before the email. Check that the page the email links to loads quickly on mobile, has a clear headline matching the email's offer, and has a simple path to conversion.
- Use automation flows instead of broadcast campaigns for purchase intent. Triggered emails sent at the right moment in the customer journey consistently convert at higher rates than batch sends.
- Segment by purchase stage. A first-time visitor and a repeat buyer need different emails. Treating them the same is one of the most common reasons conversion rate stagnates.
- A/B test the offer, not just the subject line. Subject line tests affect open rate. To move conversion rate, test the incentive, the urgency framing, or the CTA copy itself.
If conversion rate is the target, automation is usually the fastest lever. Our guide to automation campaigns that boost conversions covers the flows that consistently deliver on this email marketing KPI.
KPI 6: Bounce Rate (Hard Bounces and Soft Bounces)
Email bounce rate measures the percentage of sent emails that could not be delivered, split into hard bounces (permanent failures) and soft bounces (temporary failures), with hard bounce rate being the one that directly damages sender reputation and must be suppressed immediately.
Most ESPs report a single bounce rate figure. That's not enough information. Hard bounces and soft bounces require completely different responses, and conflating them leads to bad list hygiene decisions.
Hard Bounce vs. Soft Bounce: What Each Means
A hard bounce means the email address is permanently invalid. The mailbox doesn't exist, the domain has expired, or the address was typed incorrectly. Hard bounce rate should be below 2% on any send. Sending repeatedly to hard-bounced addresses is one of the fastest ways to destroy inbox placement rate.
A soft bounce means a temporary issue: the inbox is full, the receiving server was down, or the message was too large. Soft bounces can resolve on their own and most ESPs will retry automatically. But a contact that soft bounces repeatedly across several sends should be treated as a hard bounce risk and suppressed.
Bounce Rate Formula: (Bounced Emails / Emails Sent) x 100
How to Reduce Bounce Rate
- Use double opt-in. Double opt-in confirms the email address is valid and actively owned before it enters your list. It reduces hard bounces at source and improves every downstream email marketing KPI.
- Run list verification before major campaigns. Tools like ZeroBounce or NeverBounce identify invalid addresses before you send, keeping hard bounce rate low without damaging your sender reputation.
- Suppress hard bounces immediately and automatically. Most ESPs do this by default, but check your settings. A manual process with a lag of even a few days can cause real reputation damage at scale.
- Monitor soft bounce patterns over time. A contact that soft bounces three times in 30 days is likely a dead address. Suppress them before they become a hard bounce problem.
Bounce rate and inbox placement rate are tightly connected. High hard bounce rates signal poor list hygiene to ISPs, which depresses deliverability rate for your entire sending domain. Clean lists aren't optional.
KPI 7: Revenue Per Recipient (and Email Marketing ROI)
Revenue per recipient (RPR) measures the average revenue generated per email delivered, calculated as (total revenue attributed to the campaign / total emails delivered), and Klaviyo's email marketing benchmarks show brands generating $0.11 per recipient for campaigns and $1.94 for automated flows on average, with the top 10% of automated flows reaching $7.79 per recipient.
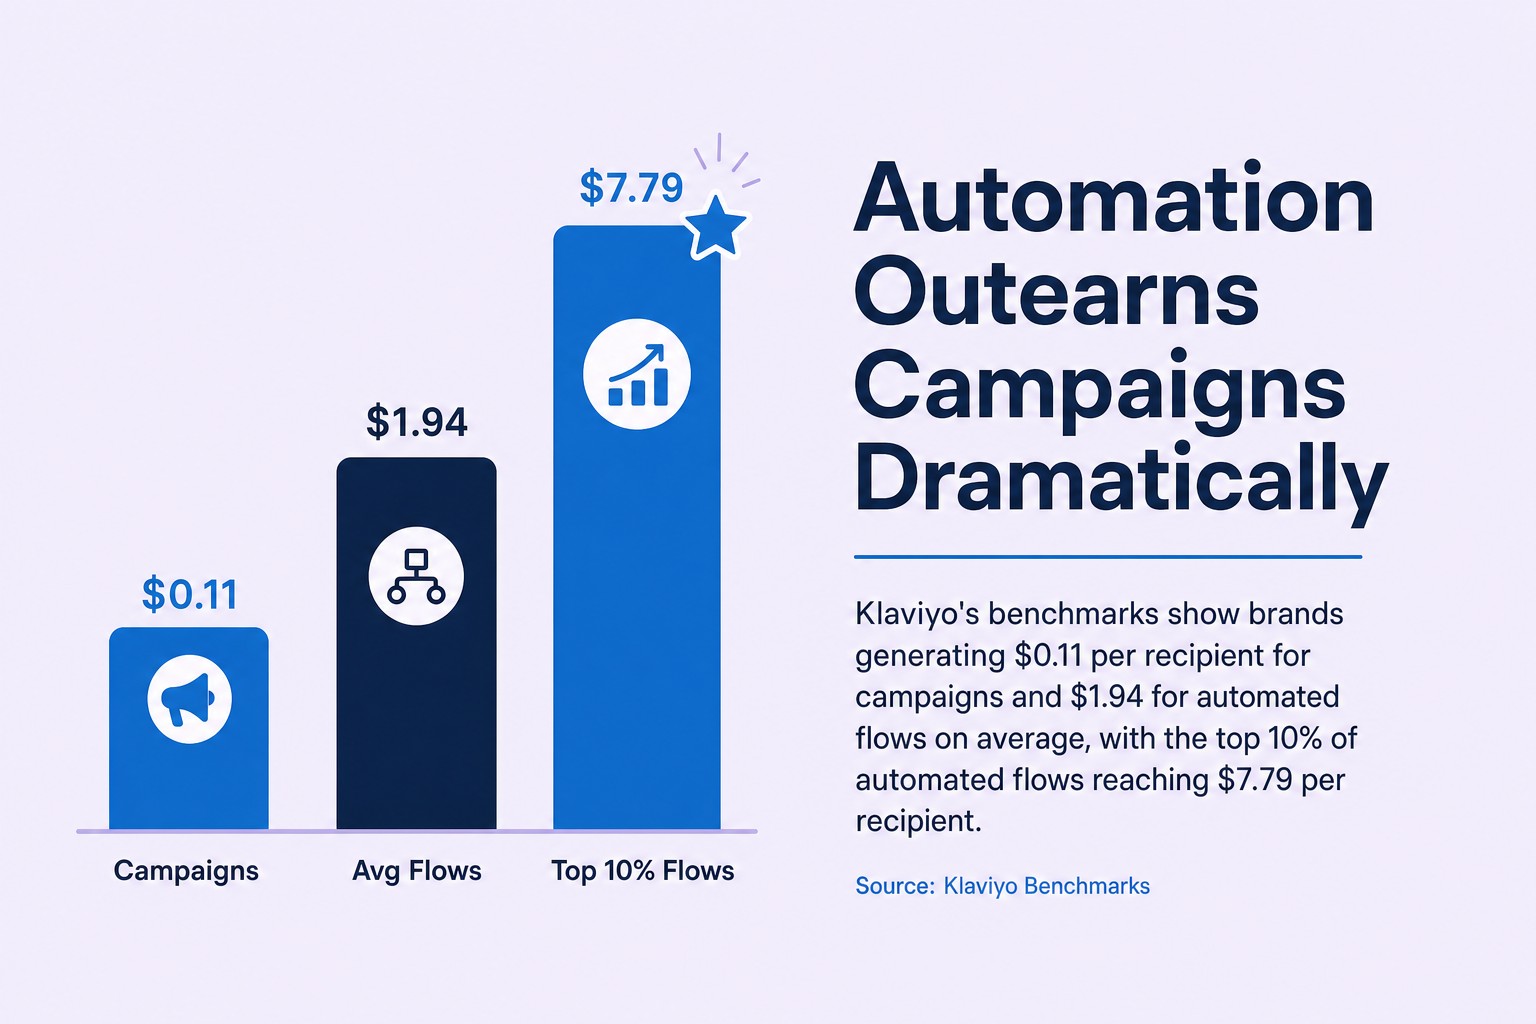
That gap between $0.11 and $1.94 is the most important number in this entire post. It's the difference between campaign sends and a properly built automation programme. If your RPR from flows isn't significantly higher than your campaign RPR, your automations aren't doing their job.
RPR, ROI, and Why Both Matter
RPR tells you the efficiency of a specific send. Email marketing ROI tells you the programme-level return. The industry-wide average sits between $36 and $42 per $1 spent based on Litmus's ROI analysis. That's a serious return for any marketing channel. But the average hides enormous variance between programmes that are actively optimised and those running on autopilot.
Use RPR to compare campaign performance, identify which segments are driving disproportionate revenue, and make the case internally for investing in automation. Use ROI to evaluate the overall health of the email marketing channel against other channels in your mix.
How to Improve Revenue Per Recipient
- Build and optimise your core automation flows first. Welcome series, abandoned cart, browse abandonment, and post-purchase flows consistently produce the highest RPR because they fire at moments of genuine intent. Our automation campaign guide covers the builds that move this metric.
- Segment campaigns by purchase history and lifetime value. A VIP segment of repeat buyers will generate a different RPR than a cold lead segment. Measuring RPR at the segment level tells you where to invest copy and design effort.
- Test revenue-driving offers, not just engagement tactics. Discounts, free shipping thresholds, and bundle offers all affect RPR differently across segments. Test systematically and track attribution carefully.
- Use zero-party data to personalise at scale. Preference centres, post-purchase surveys, and quiz-based flows let you build personalisation that goes well beyond first-name merge tags, and it consistently drives higher RPR than generic sends.
Bonus KPIs Worth Watching: Unsubscribe Rate, Spam Complaint Rate, and List Growth Rate
Three additional email marketing metrics sit just outside the core seven but directly affect the health of the KPIs above: unsubscribe rate, spam complaint rate, and list growth rate.
These aren't vanity metrics. Unsubscribe rate and spam complaint rate are early warning signals for deliverability problems. List growth rate determines whether your programme is sustainable over time.
Unsubscribe Rate
Unsubscribe rate measures the percentage of recipients who opt out after a send. MailerLite's 2025 benchmark data shows the average unsubscribe rate has risen to 0.22%. Anything above 0.5% consistently suggests a frequency or relevance problem, not a subject line problem.
The fix is almost always segmentation. Sending the same email to your entire list is one of the most reliable drivers of high unsubscribe rate. Segment by engagement, purchase behaviour, and stated preferences before you increase send frequency.
Spam Complaint Rate
Spam complaint rate is the percentage of recipients who mark your email as spam. Google's sender guidelines require a spam complaint rate below 0.10% to avoid inbox placement penalties, as reported by Martech's coverage of Google and Yahoo's bulk sender rules. Breach that threshold and your inbox placement rate will fall for your entire domain, not just the campaign that triggered it.
One-click unsubscribe, required under those same rules, actually helps here. Making it easy to leave reduces the likelihood that a frustrated subscriber reports spam instead. That's a counterintuitive win for deliverability.
List Growth Rate
List growth rate measures how quickly your subscriber base is expanding, net of unsubscribes and bounces. Industry data compiled by SHNO puts the average list growth rate at approximately 2.5% per month. Natural list decay, through unsubscribes, bounces, and inactivity, runs at around 20 to 25% per year, which means standing still isn't actually standing still.
List Growth Rate Formula: ((New Subscribers - Unsubscribes - Bounces) / Total List Size) x 100
A positive list growth rate requires active acquisition. Embedded sign-up forms, lead magnets, double opt-in flows, and lifecycle-triggered referral asks all contribute. Our email list growth service covers the acquisition and hygiene side of this in full.
How Segmentation Connects Every Email Marketing KPI
Segmentation is the single practice that improves every email marketing KPI simultaneously, and the brands that treat it as optional are the ones plateauing on every metric in this list.
Sending the same email to your entire list is a thing of the past. That's not a platitude. It's what we see in programme audits. A single broadcast send to 100,000 contacts will almost always produce lower CTR, lower conversion rate, higher unsubscribe rate, and higher spam complaint rate than the same send split into five relevant segments. Every single time.
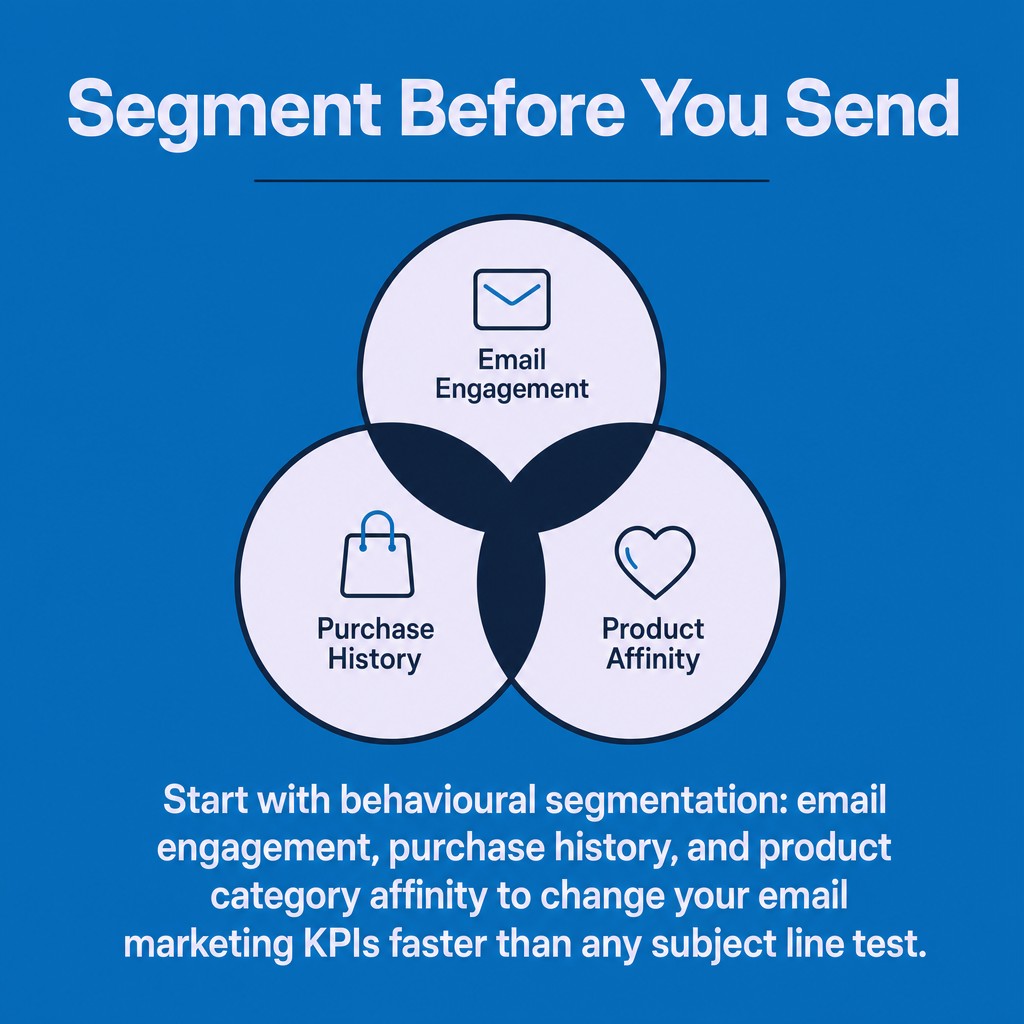
Start with behavioural segmentation: email engagement (opened in last 90 days vs. never opened), purchase history (first-time buyer vs. repeat buyer vs. lapsed), and product category affinity. These three cuts alone will change your email marketing KPIs faster than any subject line test.
Zero-party data takes this further. Preference centres and post-purchase surveys let subscribers tell you exactly what they want to hear about. That data is the most reliable input for personalisation at scale. And personalisation at scale is what separates a $0.11 RPR from a $1.94 one.
If your programme has hit a ceiling, our post on 5 signs your email marketing strategy has plateaued is worth reading before your next planning cycle.
Putting It All Together: Your Email Marketing KPI Dashboard
The seven email marketing KPIs in this post cover every layer of the funnel, from whether your emails reach the inbox to what they earn when they get there. The order matters.
Fix delivery rate and inbox placement rate first. Nothing else works if your emails aren't reaching subscribers. Then focus on CTR as your primary engagement metric, open rate as a directional signal (not an absolute), and conversion rate as the outcome that connects email performance to revenue. Track RPR and ROI at the programme level. Watch unsubscribe rate, spam complaint rate, and list growth rate as early warning signals.
The table below shows each key performance indicator alongside its formula and the benchmark to measure against:
Email Marketing KPIFormulaBenchmarkInbox Placement Rate(Inbox Placements / Emails Delivered) x 10087.2% global average [8]Click-Through Rate (CTR)(Unique Clicks / Emails Delivered) x 1002.27% average [4]Automated Conversion Rate(Conversions / Emails Delivered) x 1001.49% average [7]Unsubscribe Rate(Unsubscribes / Emails Delivered) x 1000.22% average [14]
One important note on benchmarks: they are reference points, not targets. Your own programme's trend line matters more than any cross-industry average. A CTR that has grown from 1.2% to 2.1% over six months tells a better story than a 2.5% rate that has been flat for two years.
Turning KPIs Into a 12-Month Email Marketing Roadmap
Email marketing KPIs are only useful if they connect to decisions. A number on a dashboard that doesn't change what you do next week is just decoration.
At Enchant, we build email programmes with a 12-month strategic roadmap for every client. The KPIs above are the diagnostic layer. They tell us where to invest, what to fix, and what's already working. The roadmap is what turns those insights into a programme that compounds over time.
Quarter one is almost always deliverability: authentication, list hygiene, suppression logic, and inbox placement monitoring. Quarter two moves to engagement: segmentation architecture, flow optimisation, and CTR improvement. Quarter three and four shift to revenue: RPR by segment, zero-party data capture, and lifecycle automation builds. That sequence is deliberate. You can't build revenue on a broken foundation.
If you want to see how this applies to your specific programme, our email marketing audit service starts with exactly the seven KPIs covered here and maps out where the quick wins and structural fixes sit. It's the fastest way to turn your data into a clear next step.
Summary: The Email Marketing KPIs That Drive Results
Track fewer things better. That's the most useful piece of advice in this post.
The seven email marketing KPIs covered here, delivery rate, inbox placement rate, open rate, CTR, conversion rate, bounce rate, and revenue per recipient, give you a complete picture of programme health without burying you in data. Add unsubscribe rate, spam complaint rate, and list growth rate as supporting signals and you have everything you need.
Get deliverability right first. Build segmentation into everything. Watch CTR and conversion rate as your primary performance signals. And use RPR to connect email activity to commercial outcomes that the rest of the business cares about.
Need help building a programme around these key performance indicators? Our email marketing agency team works across Klaviyo, HubSpot, Braze, Iterable, and Salesforce Marketing Cloud, and we're a Klaviyo Master Platinum Partner (their highest tier). Get in touch and we'll tell you exactly which of these email marketing metrics to fix first.